Who is this for?
Read this if you would like to monitor one or more Coda Daemons with a minimal level of human interaction.
Prerequisites - You should have the following knowledge/software installed to get the full benefit of this blog post:
- Basic Understanding of How Coda Works
- Docker
- Docker-Compose
Key Takeaways - By the end of this post, if you follow along, you will:
- Have a basic understanding of Prometheus and how it works
- Understand the role Prometheus plays in monitoring a Coda Daemon
- Have a local Sandbox Prometheus environment
The Observability Problem
From an infrastructure perspective, it’s often quite difficult to decide what to do when a portion of your system isn’t working. Often, the only thing you know for sure is that users aren’t getting the best experience and someone important wants it fixed.
It's very easy to view a crypto daemon (or any service for that matter) as a black box. It can either be running, or not, and if it's not running properly there isn't much insight into exactly what could be going wrong. Without deep insight into how your application functions, the next step can often be hard to see.

At O(1) Labs, we identified this observability problem rather quickly at the outset. Once you are running test networks of more than two or three daemons at a time, it gets hard to go peek at the logs for each instance of the daemon to diagnose an issue. It's preferable to have an at-a-glance method of verifying that a daemon is healthy and indicates unambiguously what one should do when the daemon is unhealthy.
In order to get a holistic view of the system, you’d typically take a multi-layered approach: You forward logs to a central location like Elasticsearch, Splunk, or Google Stackdriver and search through them for important indicators like error messages or stack traces. You write your application such that it exposes “application metrics” that can be collected and used to indicate what is happening internal to the application.
While you would never consider a monitoring system complete without both, this post is going to focus primarily on utilizing the onboard Prometheus endpoint to glean insight and actionable data from a Coda Daemon.
Intro to Prometheus
Prometheus is an open-source systems monitoring and alerting toolkit originally built at SoundCloud. Since its inception in 2012, many companies and organizations have adopted Prometheus, and the project has a very active developer and user community. It is now a standalone open source project and maintained independently of any company.
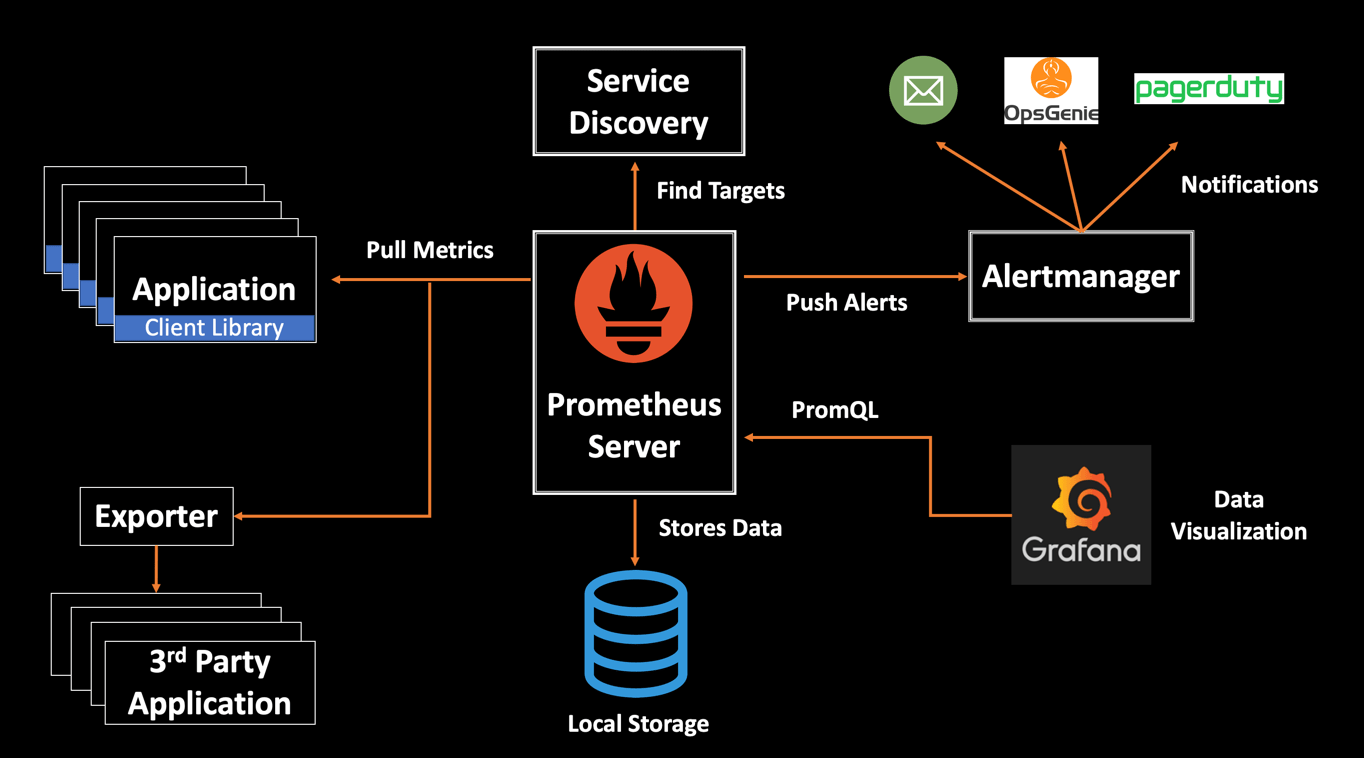
Prometheus is a "pull-based" metrics collection system - a central prometheus server is configured with either a static or dynamic set of monitoring targets and makes HTTP requests to their Prometheus endpoints. The target(s) each present their individual application metrics in a standard format via an HTTP interface, allowing the Prometheus server to scrape the same endpoint repeatedly, on an interval, collecting a time series of the exposed metrics.
Prometheus has seen massive adoption amongst tech companies both big and small, and the project has been included in the ranks of the Cloud-Native Computing Foundation making it a good choice for monitoring an open-source project.
Prometheus easily scales to tens of thousands of targets and can be run in a Docker container, making it easy to bootstrap a project and quickly ramp up your monitoring system.
Prometheus and Coda
Now that you have an idea of how Prometheus works at a high level, let's look at how you can leverage a Prometheus installation to monitor one or more Coda Daemons.
Run a Daemon with Metrics
Note: Docker provides us a portable, os-agnostic method to run the Coda Daemon, but all examples could be translated to a native installation.
The Coda Daemon has been outfitted with an optional Prometheus Endpoint -- to activate it you must pass -metrics-port <PORT> to the CLI at runtime:
docker run -p 10000:10000 codaprotocol/coda-daemon:0.0.11-beta4 daemon -metrics-port 10000
Let's break this command down:
docker run: run a docker container-p 10000:10000: bind Port10000inside the Docker Container to the Docker Hostcodaprotocol/coda-daemon:0.0.11-beta4: an official Coda docker image from dockerhub, version0.0.11-beta4daemon -metrics-port 10000: the argument(s) to thecodaCLI -- run a daemon and expose prometheus metrics on port10000
You should see output like the following:
$ docker run -p 10000:10000 codaprotocol/coda-daemon:0.0.11-beta4 daemon -metrics-port 10000
2020-01-02 22:33:42 UTC [Info] Coda daemon is booting up; built with commit "bd5715a3f00754869498083b2506db776a7047e2" on branch "master"
2020-01-02 22:33:42 UTC [Info] Daemon will expire at "2020-01-15 14:00:00-07:00"
2020-01-02 22:33:42 UTC [Info] Booting may take several seconds, please wait
2020-01-02 22:33:52 UTC [Info] Daemon started process of kind "Prover" with pid 80
2020-01-02 22:33:53 UTC [Info] Daemon started process of kind "Verifier" with pid 92
2020-01-02 22:33:54 UTC [Info] libp2p peer ID this session is $peer_id
   peer_id: "12D3KooWRd6oDEwVoKmZnAZWokqTqUjmsypFyGBeLbU4Wp4UjCqE"
2020-01-02 22:33:54 UTC [Info] Starting Bootstrap Controller phase
2020-01-02 22:33:54 UTC [Info] Coda daemon is now connecting
2020-01-02 22:33:54 UTC [Info] Pausing block production while bootstrapping
2020-01-02 22:33:54 UTC [Info] Attempted to turn on snark worker, but snark worker key is set to none
2020-01-02 22:33:54 UTC [Info] Daemon ready. Clients can now connect
2020-01-02 22:33:54 UTC [Info] Created GraphQL server and status endpoints at port : 3085
If you open localhost:10000 in a browser you will see all the metrics encoded in the standard Prometheus format. Comments begin with a # and Metrics are of the form metric_name metric_value.
For example, the Coda_Bootstrap_bootstrap_time_ms metric denotes the length of time that elapsed while the Daemon was in the bootstrapping state (in milliseconds):
#HELP Coda_Bootstrap_bootstrap_time_ms time elapsed while bootstrapping
#TYPE Coda_Bootstrap_bootstrap_time_ms gauge
Coda_Bootstrap_bootstrap_time_ms 377529
...
If you have any questions about a particular time series exposed by the Daemon, checking the help text (denoted by #HELP) is a good first place to look.
Set up Sandbox Prometheus
I have set up an example repository located here, the important stuff you'll need for a basic local Prometheus + Coda installation is included below:
docker-compose.yml
This project uses docker-compose, a tool for orchestrating multiple docker containers on the same machine. It has an extensive feature-set and I encourage you to check out the documentation should you want to learn more.
prometheus.yml
This is the prometheus configuration file which targets to scrape and how to scrape them.
To run this example, first clone the example repository:
git clone https://github.com/yourbuddyconner/coda-examples.git
Move to the basic-prometheus directory:
cd coda-examples/basic-prometheus
Run docker-compose:
docker-compose up
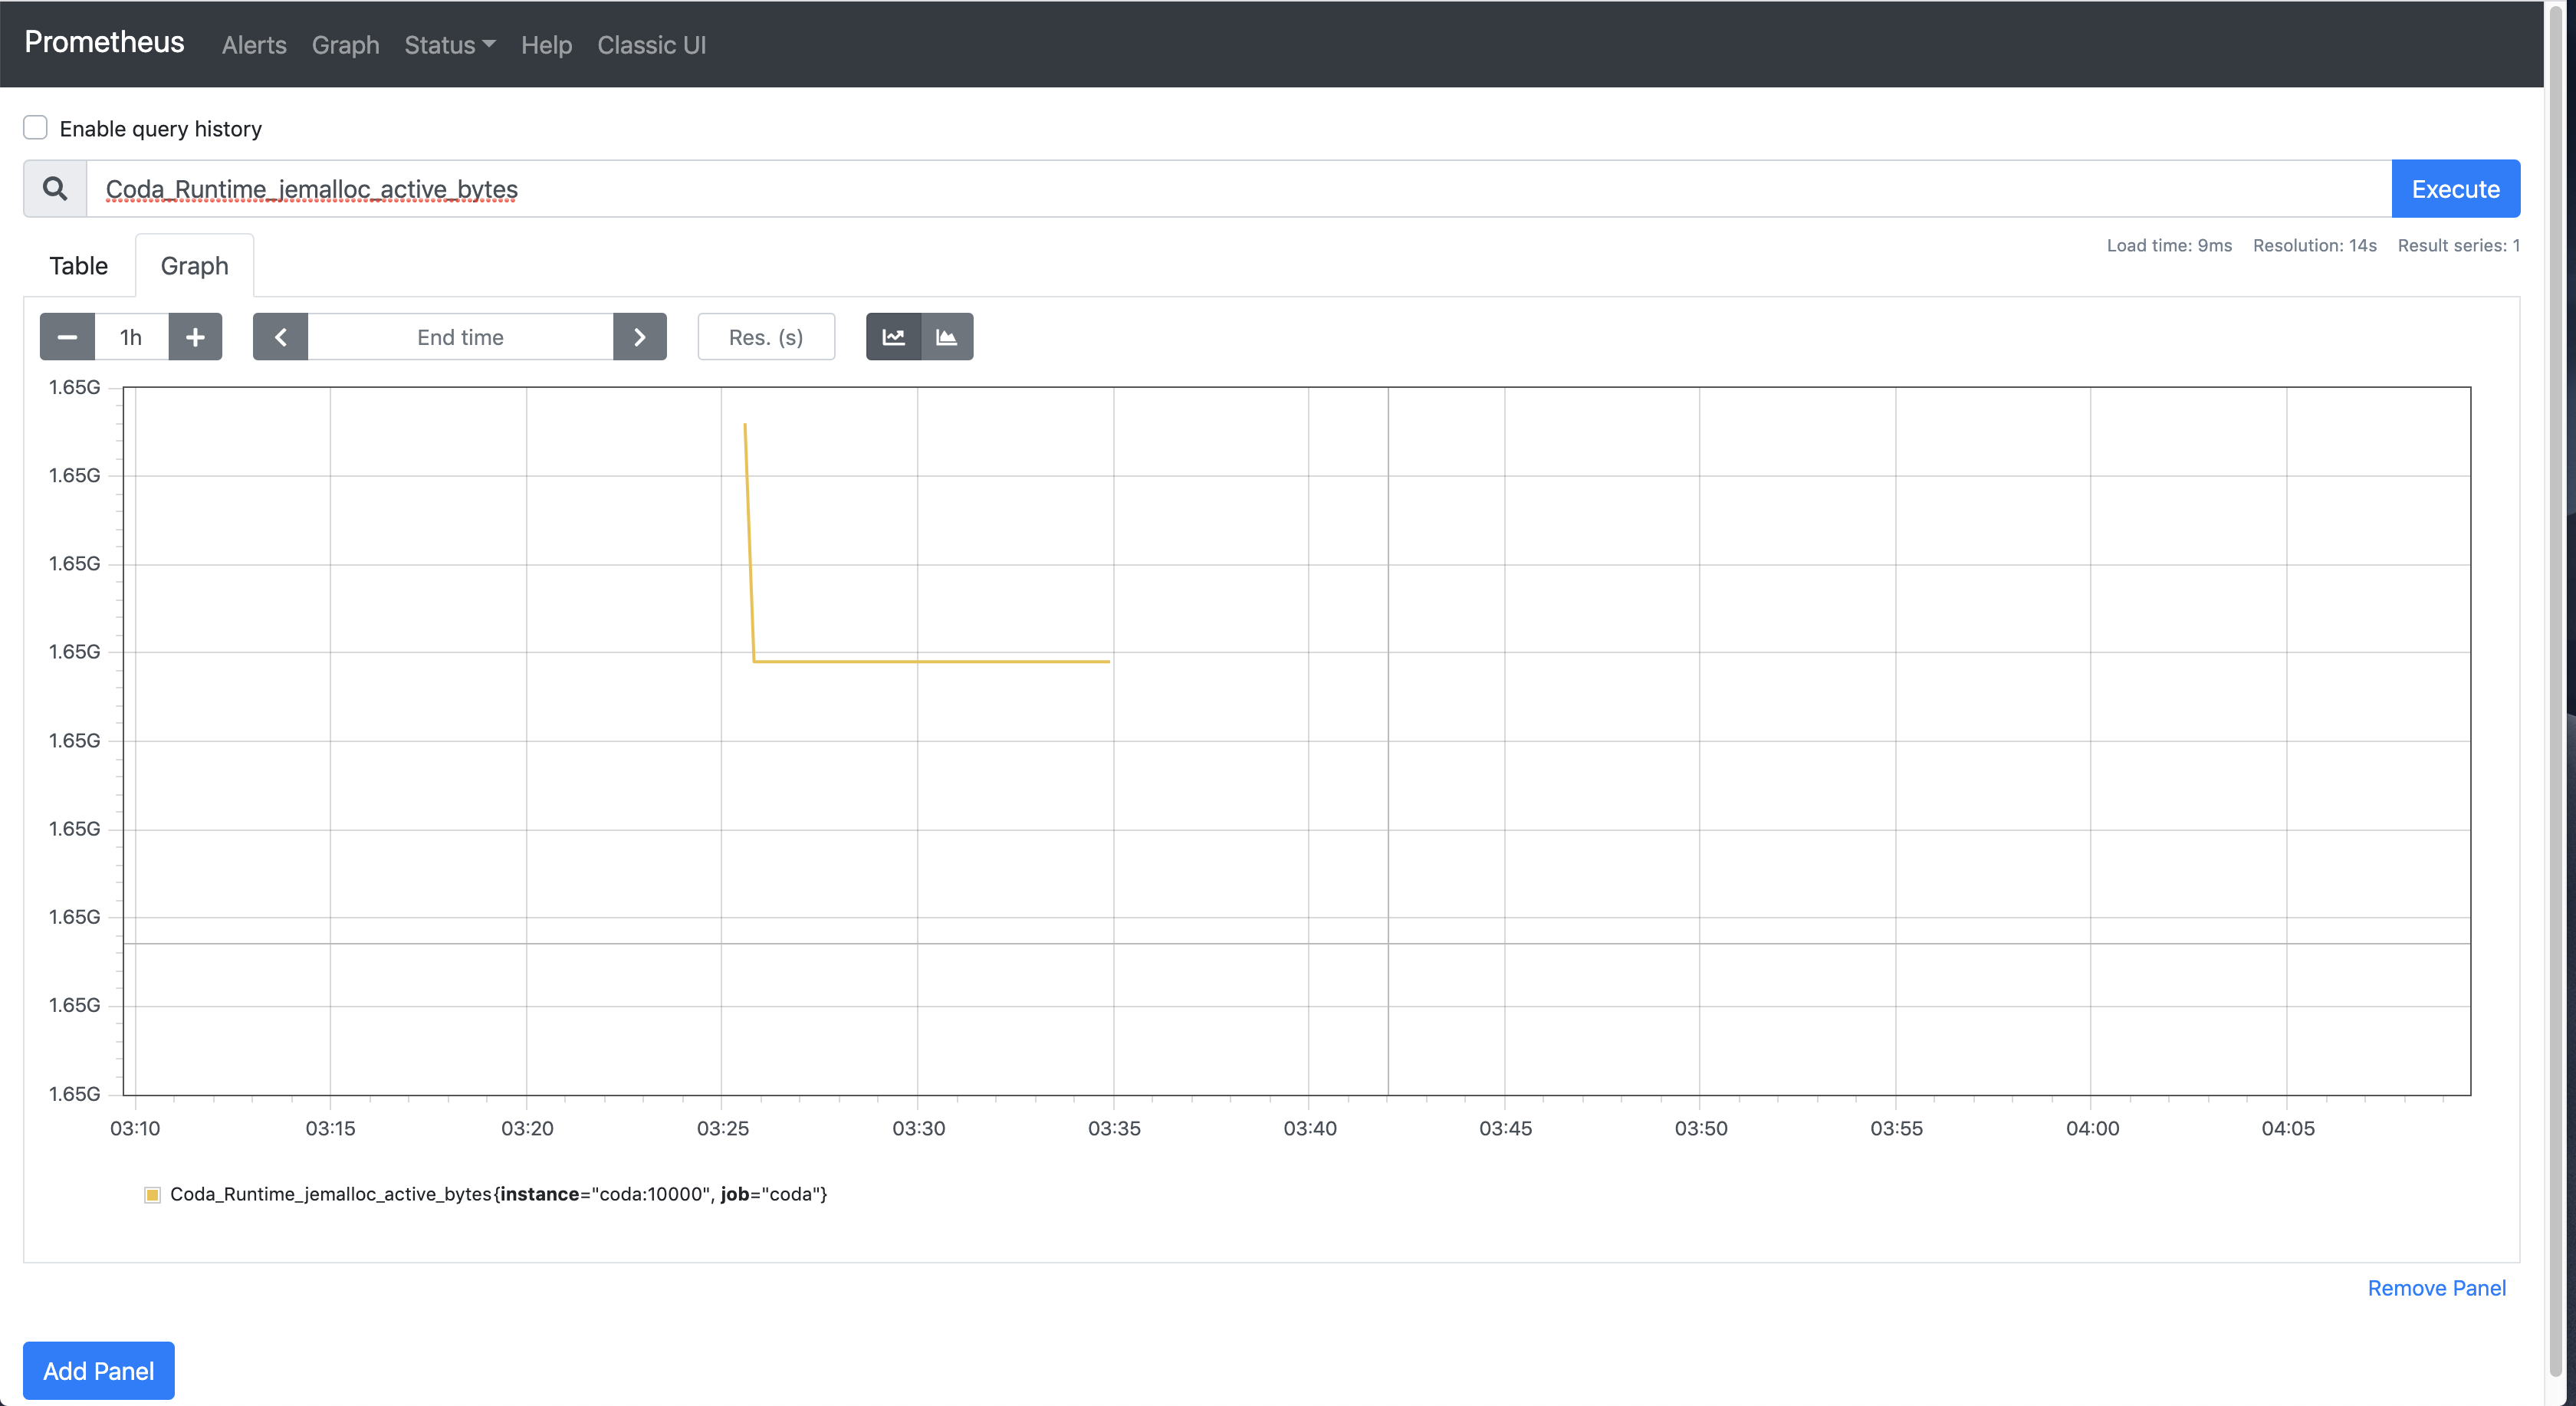
You should now be able to navigate to localhost:9090 in your browser to get access to the Prometheus UI.
Actionable Metrics
Note: All graphs are embedded from one of the following public dashboards:
While all of the exposed metrics are useful, only a few produce actionable data from a node operation perspective. The following are useful in normal node operations:
Node Uptime
This counter is useful in alerting, as it should never reset to 0. The only scenario in which it would do so would be in the event of the Coda Daemon process restarting.
#HELP Coda_Runtime_process_uptime_ms_total Total time the process has been running for in milliseconds.
#TYPE Coda_Runtime_process_uptime_ms_total counter
Coda_Runtime_process_uptime_ms_total 1.73959e+08
Max Observed Block Length
Can be an indicator of forks when compared across several nodes. Reporting this to the Coda Community when in doubt is highly useful.
#HELP Coda_Transition_frontier_max_blocklength_observed max blocklength observed by the system
#TYPE Coda_Transition_frontier_max_blocklength_observed gauge
Coda_Transition_frontier_max_blocklength_observed 11567
Blocks Produced
While blocks produced is useful on its own as a simple counter, it is particularly useful when diagnosing block production issues. By combining it with Prometheus query functions like sum and increase, we can derive a running rate of block production.
Example query:
sum(increase(Coda_Proposer_blocks_proposed{testnet="$testnet"}[1h]))
#HELP Coda_Proposer_blocks_proposed blocks produced and submitted by the proposer
#TYPE Coda_Proposer_blocks_proposed counter
Coda_Proposer_blocks_proposed 0
Banned Peers
When taken alone, banned peers is only useful for indicating that individual nodes are misbehaving, however when analyzed alongside other metrics (e.g. Max Observed Block Height) it can be an indicator of systematic network-level bugs/forks.
#HELP Coda_Trust_system_banned_peers # of banned ip addresses
#TYPE Coda_Trust_system_banned_peers gauge
Coda_Trust_system_banned_peers 1
Coda SNARK Work Fee Breakdown
Useful in helping to tune SNARK Worker fee selection.
ex. If there is a lot of low-fee SNARK work in the pool, an automated system could turn off SNARK work compute until it is more economical to resume.
#HELP Coda_Snark_work_snark_fee A histogram for snark fees
#TYPE Coda_Snark_work_snark_fee histogram
Coda_Snark_work_snark_fee_sum 5933
Coda_Snark_work_snark_fee_count 5512
Coda_Snark_work_snark_fee_bucket{le="+Inf"} 5512
Coda_Snark_work_snark_fee_bucket{le="9"} 5512
...
Next Time: Production GKE Setup
In the next blog post in this series, I'll show you how to set up a Coda node on Google Kubernetes Engine!
Get Involved With Coda!
The Coda Protocol is still very much in active development, and the O(1) Team is constantly pushing out features like this -- there's so many ways to get involved:
-
Have an idea for some other cool thing I haven't mentioned? Join the Coda Community, and lets talk about it!
-
Want to operate a Node on the Coda Network? There are regular Testnets that are designed to help us surface bugs and teach the community how to use Coda. Come join us!
-
Want to spend some time building something useful to the Coda Community? Check out the Coda Grant Proposal Repository for a list of projects O(1) Labs is sponsoring.
Lastly, if you decide to make something cool with this let me know on Twitter or the Coda Discord Server -- you can find me with @conner!