What's Coda?
Coda is a Crypto Protocol that I am working on as part of the O(1) Labs Team. Coda implements a "succinct" blockchain that effectively "swaps the traditional blockchain for a tiny cryptographic proof."
Practically, this means that in the average Coda node, once a block with transactions is "swapped" for a proof, it gets thrown out to save disk space.
Earlier blockchain implementations like Bitcoin and Ethereum don't have this ability, and as such the hardware requirements for running a Node on their networks increase steadily with the size of their respective chains (240GB and >1TB respectively).
The Problem
When I decided to sit down and get my roommate @reem to help me with this visualization, it was to try and solve one particular issue I'd been having. There wasn't a way to at-a-glance verify that the network was forked!
Put simply, a "Fork" is what happens when a blockchain diverges into two or more paths forward. They can occur for a multitude of reasons:
- intentional forks which can be scheduled and relate to protocol upgrades or hotfixes to the blockchain
- unintentional forks due to hardware outages, network partitions, or protocol bugs
In most blockchain contexts, the consensus algorithm is designed to work forks out as a matter of course, but when they don't work out it's an indicator that something is wrong. In any protocol that is in active development, knowing an unintentional fork is occurring and quickly identifying the root-cause has an incredible amount of utility from an observability perspective -- both to the protocol developers and any community members who might be participating on a network.
Fortunately for me, John Wu (@wu-s-john), one of the O(1) protocol engineers, had just implemented basic block archive functionality that allows a node to store all blocks that it observes, along with all the associated metadata. Armed with this data, I figured we could build a nice visualization of the chain and any forks.
The Visualization
The blockchain visualization is implemented using React, the Apollo GraphQL Client, and React-Vis-Force a library for building D3-based force-directed graphs. Since I had used this kind of graph in the past, I opted to stick with something I was comfortable with -- as I will mention later, this might not have been the best approach.
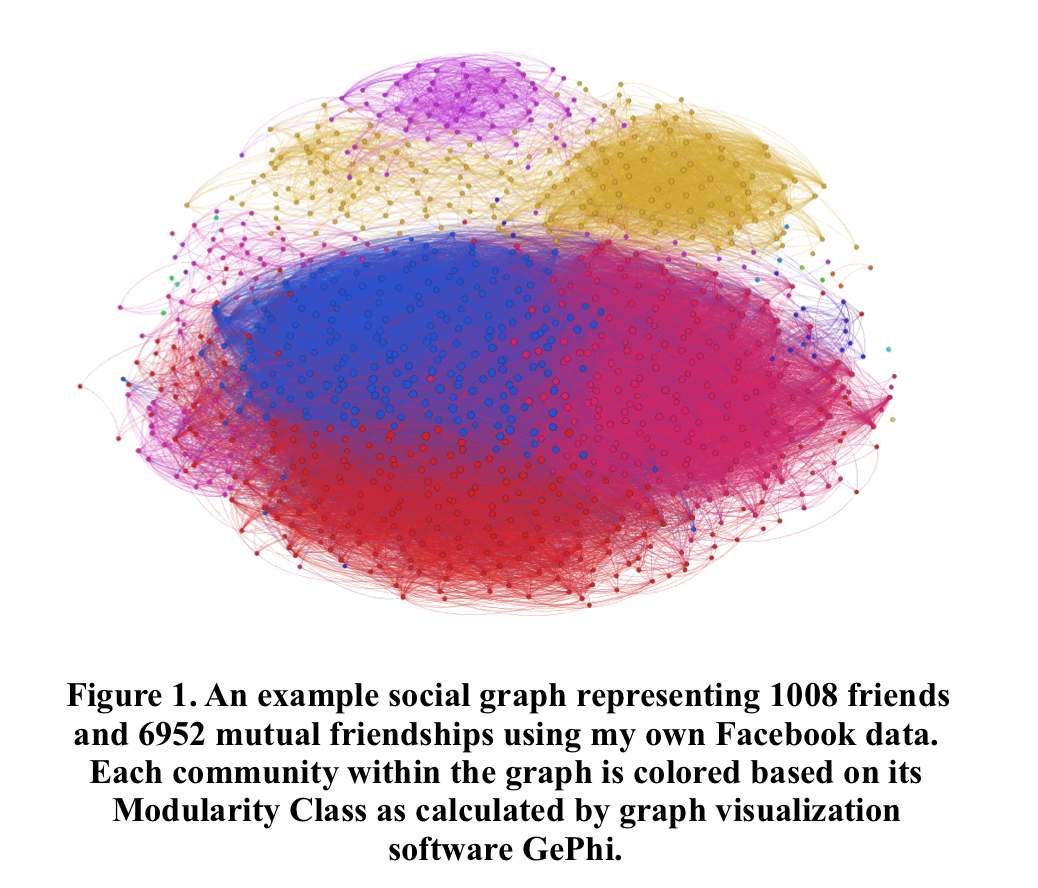
A graph from a previous project:
This is an animated gif of the visualization with roughly 400 blocks depicted:
While it's not the most practical, I really like this visualization because it feels organic somehow. Leaving it up on a TV or extra monitor has a lava lamp vibe that I enjoy -- it's art!
Lessons Learned
There's a bunch of stuff I would have done differently had I been designing this for deployment in a production setting:
Live Loading of New Blocks
The visualization is pretty cool, but it needs to be reloaded every 5-10 minutes or so in order to retrieve new blocks that might have been produced. I discovered to my dismay that React-Vis-Force doesn't allow you to dynamically add and remove nodes in the graph without reloading the whole thing. In order to get this working, I'd have to fork their library or craft my own D3-based react components.
Block Pagination
Due to the Archive functionality overriding the normal behavior of the Coda Daemon, there can be a lot of observed blocks in the database. Additionally, the blocks query in the Coda Daemon's GraphQL endpoint doesn't actually support pagination at the time of writing, so loading the page gets slow as nBlocks increases. Though, even if it did support pagination, you'd still have to load all the blocks first due to the lack of live loading.
This obviously is only an issue in the current Archive Node implementation, and there's an RFC in the works for a more robust Archive process.
Node Arrangement On Load
When there's a lot of nodes on the graph, it takes a really long time to work all the crossings out. I wished there was a way I could have laid out the nodes from left-right/top-bottom by their timestamp at render time.
CORS Proxy
Since the Coda Daemon is serving data on a different URI than my development server, CORS comes into play. Since the Daemon doesn't support CORS headers, I had to run it through a proxy that would add the appropriate headers for me. Luckily, there's plenty of packages that do this, and I opted to use local-cors-proxy.
Archive Node Proxy
The Archive node's endpoint is dangerous in that there is no authentication, so anyone with access could change the Daemon's internal state. As such, the visualization is only compatible with a Daemon running on the same machine. I would love to build out a GraphQL Proxy of some kind in order to mitigate this risk.
More Useful "Block Explorer" Functionality
I did implement some basic "block explorer" functionality, in that if you select a node a div appears with the JSON data from the block. I would have liked to spend more time displaying this data on the graph itself, via colors, numerical badges, or otherwise.
Click and Drag Nodes
One other major feature that would make the visualization feel more interactive would obviously be draggable nodes on the graph. D3 has full support for interactive elements, but it's another thing that wasn't possible with the React-Vis-Force library.
Different Color Profiles
I would love to mess with different colorings on the graph way more than I did here. This visualization can be super useful for visually debugging the blockchain by coloring the blocks based on number of transactions, snark jobs, fee transfers, etc.
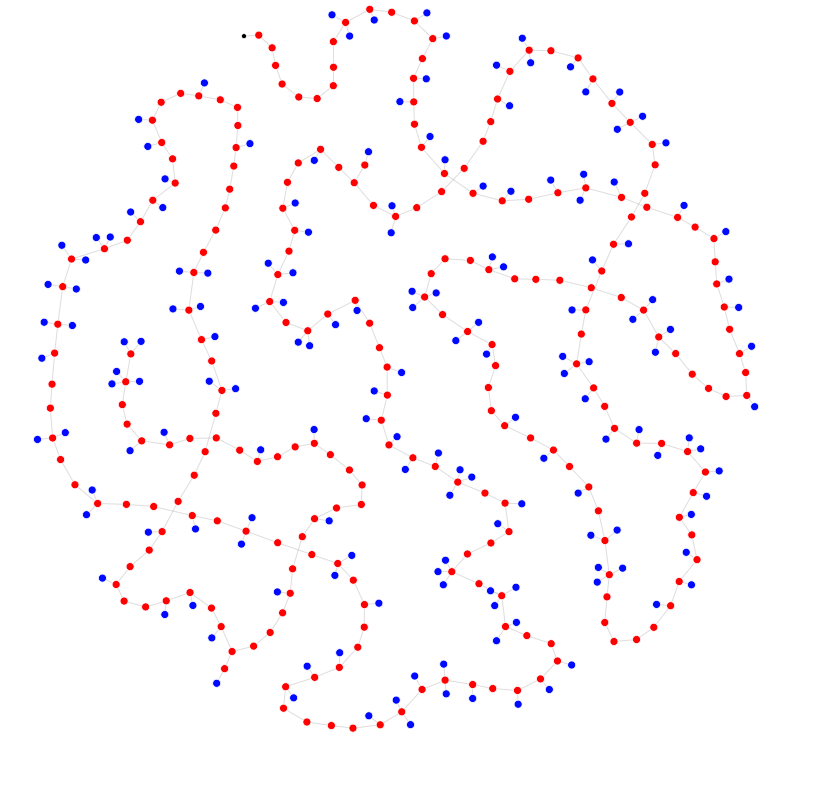
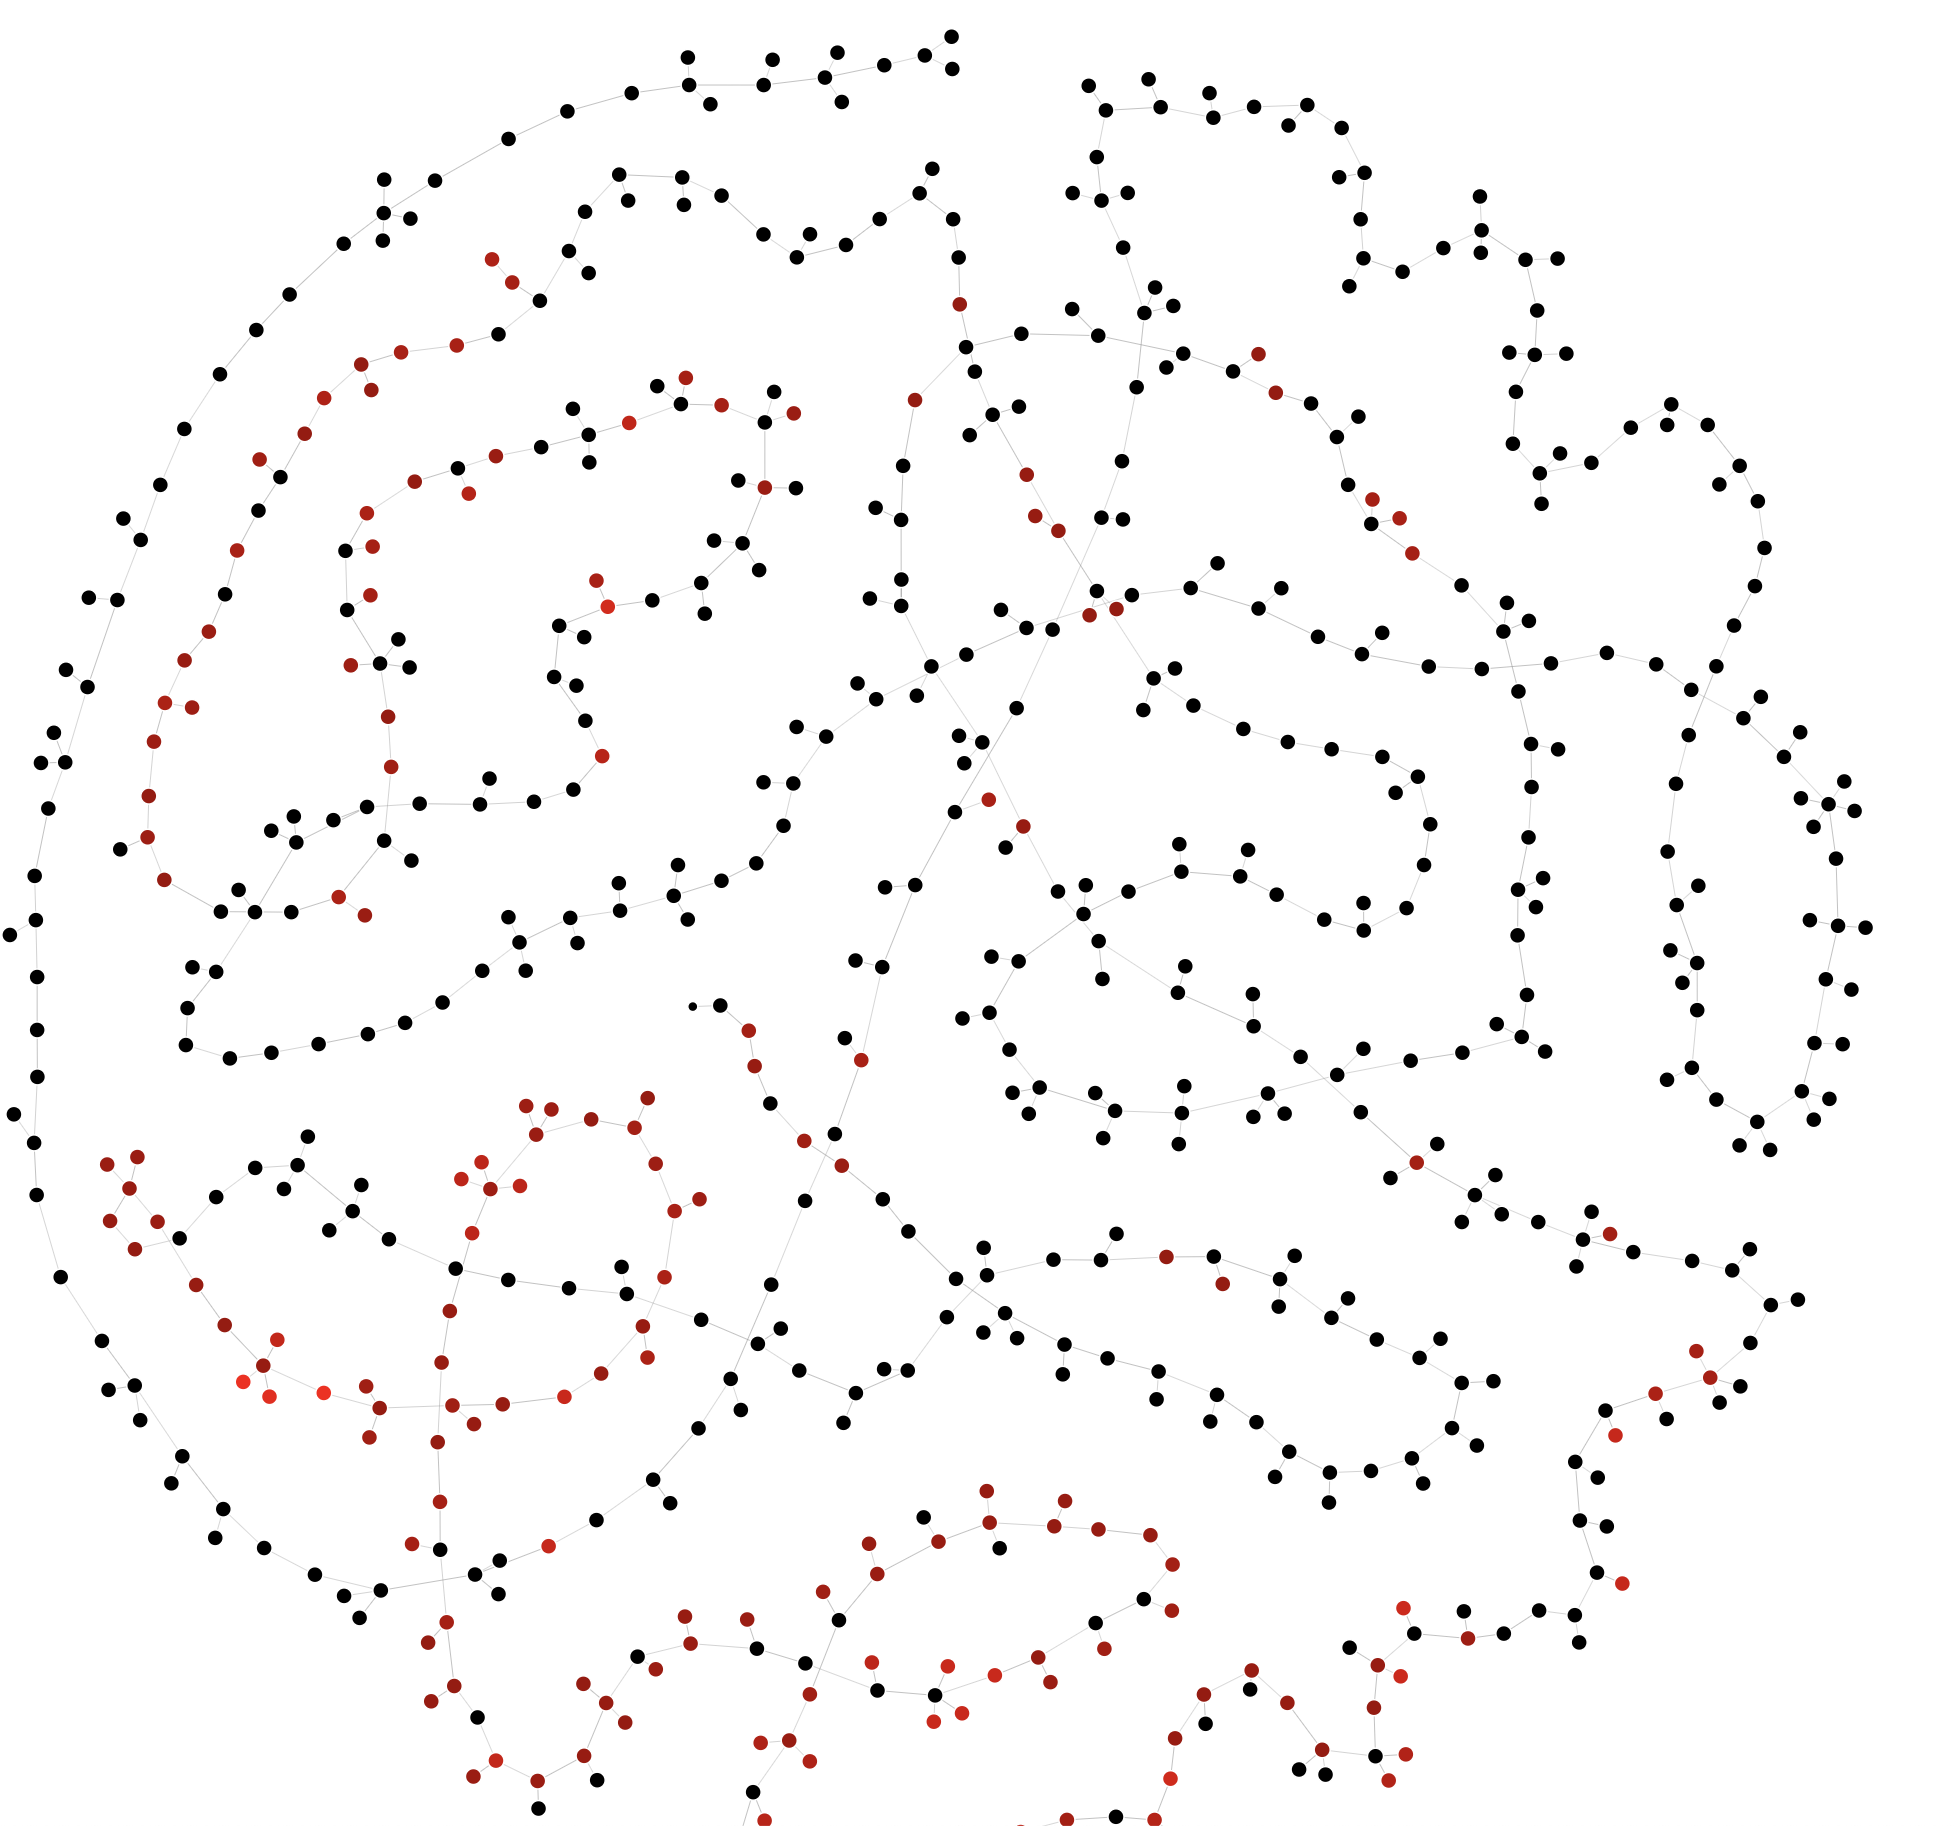
Examples of Different Coloring:
Red -> Main Chain / Blue -> Leaf Nodes:
Black -> No Txs / Redder -> More Txs
Think You Can Do Better? (I Bet You Can!)
I am confident that there are people out there who are better at Javascript than I am. This was done in a few days with little regard for practical deployment concerns. As such, the project is licensed under the Apache License 2.0, which is a permissive license that allows for derivative works!
Check out the repository here.
The Coda Protocol is still very much in active development, and the O(1) Team is constantly pushing out fun projects like this -- there's so many ways to get involved:
-
Have an idea for some other cool thing I haven't mentioned? Join the Coda Community, and lets talk about it!
-
Want to learn how to operate a Node on the Coda Network? There are regular Testnets that are designed to help us surface bugs and teach the community how to use Coda. Come join us!
-
Want to spend some time building something useful to the Coda Community? Check out the Coda Grant Proposal Repository for a list of projects O(1) Labs is sponsoring.
Lastly, if you decide to make something cool with this let me know on Twitter or the Coda Discord Server -- you can find me with @conner!