If you've read some of my older posts, you might have seen this one about my personal analytics project project where I used Splunk to index 50,000+ text messages and preform analysis on them.
Keeping with the Splunk theme, early this fall I put together a classroom presentation on the Splunk to introduce students at Northern Arizona University to the software and help them understand the sorts of use-cases it is really useful for. Today, I decided to take the general information contained within the presentation and turn it into a handy blog post for those people who might be googling "What the heck is Splunk?!" or something similar.
This is part one in a multi-part post. Today I'll discuss the multitude of problems Splunk is targeting and how it uniquely solves them in a way that is capable of affecting how an entire business handles their day-to-day workflow. ~~Stay tuned for~~ Here's the next post where I'll put the Splunk workflow into context with real-world use cases!
The Problem
In this day and age, the majority of "Enterprise Data" is generated by machines preforming a variety of different functions at any given time. Often-times, this data that's generated and saved to log files is not human-readable, and when it is human-readable there's often too much of it to process manually.
This data comes from tens, hundreds, or even thousands of different applications, all of whom potentially output their logs in as many different formats as there are applications.
Splunk has a multitude of use-cases, from IT Analytics to planning marketing campaigns. The following are some problems people in varying positions of might use Splunk to solve:
- Dan the developer is asked to help figure out why his code is crashing on Sundays at Midnight
- Sally the SysAdmin has no idea why users from one office location can’t log in to their computers
- Ivan the InfoSec Analyst has no idea a hacker in Bulgaria is sending spam from his servers
- Billy the Business Analyst needs to figure out what localities are using his company’s applications
- Molly the Marketing Executive needs to analyze her affiliate marketing campaigns to see if improvements can be made
Machine Data is the most rapidly growing segment of the arena experts call "Big Data." This stuff gets generated 24 hours a day, 7 days a week, 365 days a year and will continue to be generated forever. This set of data contains a categorical record of everything a user does online (and oftentimes offline). The main problem is that the value from this data is, for the most part, untapped -- the data sits on a server until it gets deleted to make room for more data that rarely (or never) gets looked at.
What Does Machine Data Look Like?
When talking about how difficult "Machine Data" is to process manually, it's really important to be able to visualize exactly why it's so difficult to process. Below are some examples text that Splunk might consume:
HoneyPot Logs:
2015-10-17 13:08:51-0700 [SSHService ssh-userauth on HoneyPotTransport,2323,93.158.203.167] login attempt [root/12345] succeeded
Webserver Logs:
64.242.88.10 - - [07/Mar/2004:16:05:49 -0800] "GET /twiki/bin/edit/Main/Double_bounce_sender?topicparent=Main.ConfigurationVariables HTTP/1.1" 401 12846
Tweets:
{
    "created_at":"Mon Sep 28 19:39:04 +0000 2015”,
    ”user”:”yourbuddyconner",
    "id":648582717068587000,
    "id_str":"648582717068587009",
    "text":"The amount of local news stations treating the Facebook outage as news is too damn high. #FacebookDown #TwitterIsUp #Facebook”,
    "entities": {
        "hashtags":[
            {
                "text":"FacebookDown",
                "indices":[89,102]
            },
            {
                "text":"TwitterIsUp",
                "indices":[103,115]
            },
            {
                "text":"Facebook",
                "indices":[116,125]
            }
        ],
        "symbols":[],
        "user_mentions":[],
        "urls":[]
    }
}
Text Messages:
message_id=53088
timestamp="2015-02-03 20:30:06"
date_read="2015-02-03 20:29:20"
is_from_me=1
is_read=1
handle=+9999999999
service=iMessage
message="I mean, I can, those pancakes were so good"
As I hope you can see, the data above is incredibly dense and hard to parse by the human eye unless you're trained to know what to look for. Even to the untrained eye though, if you look closely, there's a lot of data contained in these short excerpts -- there's timestamps, hashtags, messages, HTTP Methods, IDs and more!
When you think about it, it might be possible to connect these discrete events together, timestamp to timestamp, username to username, etc. If only you had a platform that could read and understand these disparate formats!
Enter Splunk
Well, lucky for you, Splunk does just that! Splunk fills several roles when it comes to "Operational Intelligence".
- The Splunk Universal Forwarder collects lines from log files as they are added to end-systems and forwards them to the Splunk Indexer.
- The Splunk Indexer parses log events sent to it from the Universal Forwarder or by other means, splits them into key-value fields, and stores them for safe-keeping
Now, this may not seem too groundbreaking, however, when you consider that this interaction occurs constantly and that old data gets saved in Splunk's data warehouse, there's a lot of power to be had.
Business Reactivity
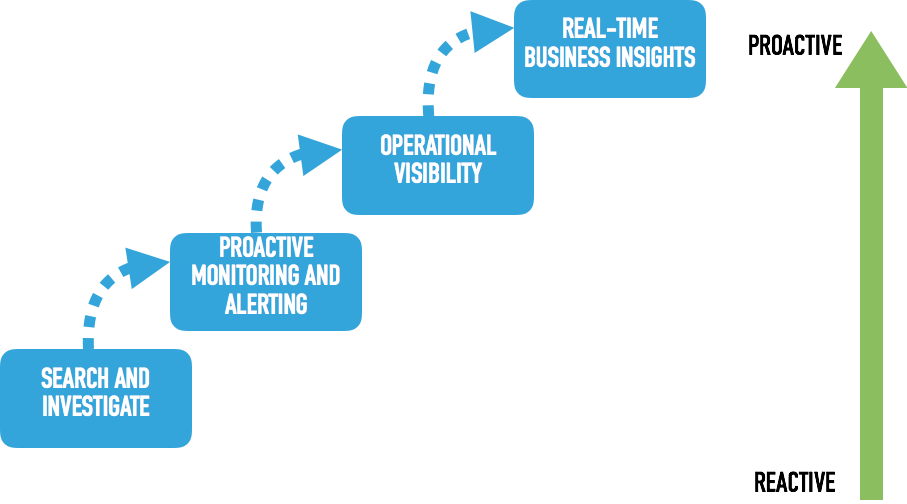
The diagram above describes different stages of "Reactivity" in a business. At the lower left we have, "Search and Investigate." A business at this stage finds out things are broken hours or sometimes days after-the fact. Fixing a problem a business like this might be facing often requires a person to manually read over days of log files to figure out what went wrong.
The two intermediate states "Proactive Monitoring and Alerting" and "Operational Visibility" describe a business who has some good practices in place that allow them to be less reactive. Operational Visibility is the ability to see how each part of your system is communicating with one another, usually in one place, a dashboard for example. (As an aside, Netflix has a really good Blog Post about how they use real-time data analysis to improve their Operational Visibility.) This entails knowing when and what sorts of data is being passed around at any discrete point in time. This is immensely useful when a piece of a distributed system is acting up and someone needs to get down to fixing it.
The upper-right state is "Real-Time Business Insights." A business who has processes in place to achieve this is in the best shape of all when it comes to being proactive. It implies that the business has both historical and real-time data to analyze and make up-to-the-minute decisions with. Splunk takes businesses immediately to this stage if well thought-out and implemented.
Splunk Helps You to be "Proactive"
By storing historical data, Splunk allows a user to determine baselines in activity and look at how those baselines have changed over time. With a little help from someone who knows the Splunk query language, it can identify what is considered to be "normal" behavior and also anomalous events that might affect business decisions.
In addition, Splunk enables the IT Professional to share their complex data with people who might not be as versed in it as they are. This is done through the use of visualizations and graphs which can then be inserted into Splunk Dashboards for repeated use. This removed the overhead of having to know what the data looks like, and instead digesting insights in aggregate through pictures.
By implementing a Splunk Cluster on-site, many successful and well-known companies have leveraged the power of Splunk to increase the value of the company as a whole and provide value to pre-existing business decision-making processes.
In my next post, I'll be going over some real use-cases for Splunk and case-studies that examine Splunk use in the wild. Stay tuned!
Do you use Splunk? Hit me up on Twitter and let's talk! @yourbuddyconner