![]() I've been using Splunk a lot at work. According to their website:
I've been using Splunk a lot at work. According to their website:
You see servers and devices, apps and logs, traffic and clouds. We see data—everywhere. Splunk® offers the leading platform for Operational Intelligence. It enables the curious to look closely at what others ignore—machine data—and find what others never see: insights that can help make your company more productive, profitable, competitive and secure. What can Splunk do for you? Just ask.
My team uses the software to index and search through wide-ranging, potentially disparate datasources like server logs, google logins, data from our honeypot, and more. It fills so many use-cases, from tracking down users who have had their passwords phished to allowing us to pinpoint machines which are being tampered with (thanks to the wonder that is OSSEC). It's got a really steep learning curve, but once you get the hang of it, administering a distributed Splunk environment is actually pretty fun.
Since I've been using Splunk so much, I wanted to give it a spin on a personal project. I had read at some point that iOS's text messages are stored in a SQLite database, so I decided to try and pull that data out and do some analysis on it.
SQLite has the advantage of being a flat file, making it perfectly suited for applications where network access either isn't needed or isn't readily available. Luckily for me, the Splunk DB Connect app can natively parse SQLite and index the data as key-value pairs.
As it turns out, the iOS text messaging database has been pretty heavily documented in the past, and by using the information here I was able to extract the text message database from a backup of my iPhone. There were a lot of entries in this 37MB database, the messages table has over 50,000 entries, each one representing either an outgoing or incoming text message.
The database also has a 'Handles' table, which stores information about the phone number the user is communicating with. Without joining the two tables, the data is incomplete, so I crafted a SQL query to grab the data I wanted to index from the table. This query is fed to the Splunk DB Connect app which then takes care of parsing out all 53,024 rows and splitting them up into indivudual events.
SELECT message.ROWID as message_id,
    datetime(message.date,'unixepoch', '+31 years', '-6 hours') as timestamp,
    datetime(message.date_read, 'unixepoch', '+31 years', '-6 hours') as date_read,
    message.is_from_me as is_from_me,
    message.is_read as is_read,
    handle.id as handle,
    message.service as service,
    message.text as message FROM message,
    handle
WHERE message.handle_id = handle.ROWID;
The SQL Query to create complete events
Once Splunk has digested the data, heading to the Search & Reporting app and typing index=text_messages into the search box gives me a nice frequency graph and a list of events:
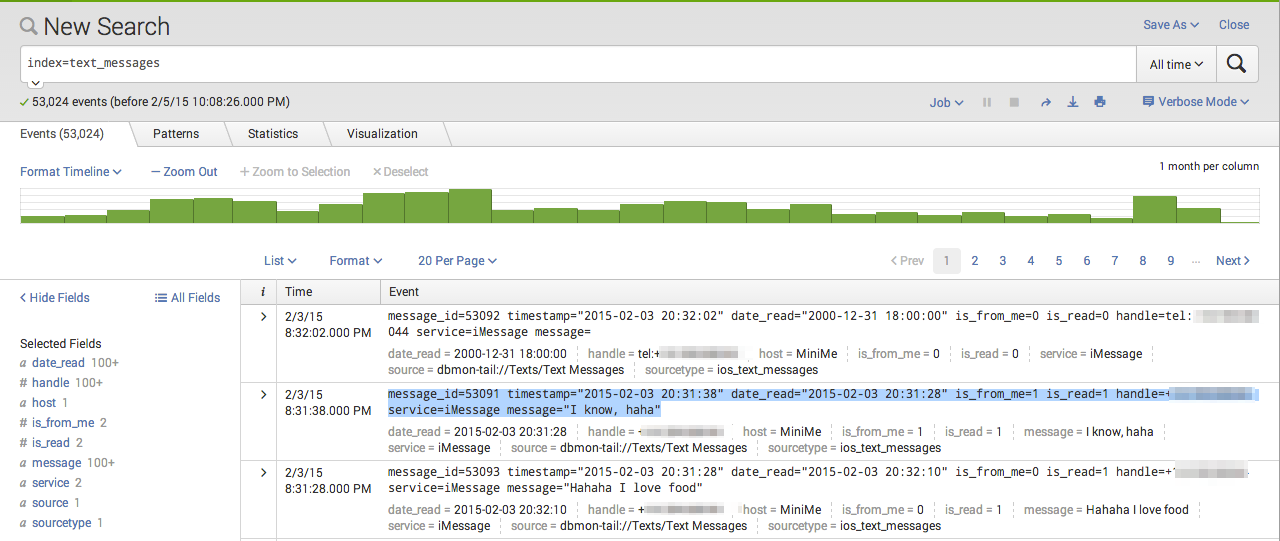
Each text message event is just a line of text that looks like this:
message_id=53091 timestamp="2015-02-03 20:31:38" date_read="2015-02-03 20:31:28" is_from_me=1 is_read=1 handle=+xxxxxxxxxx service=iMessage message="I know, haha"
Using Splunk's powerful search tools and some apps created by the Splunk community, I could begin doing some batch processing of all the events.
Since I have so much text, the first thing I did was download a Sentiment Analysis app. Doing so adds a couple dashboards and the "sentiment" search command which will evaluate one field in every event you give it, assigning the event a positive or negative value.
Armed with this new field, I can now create some inferential data about the contents of the database as a whole.
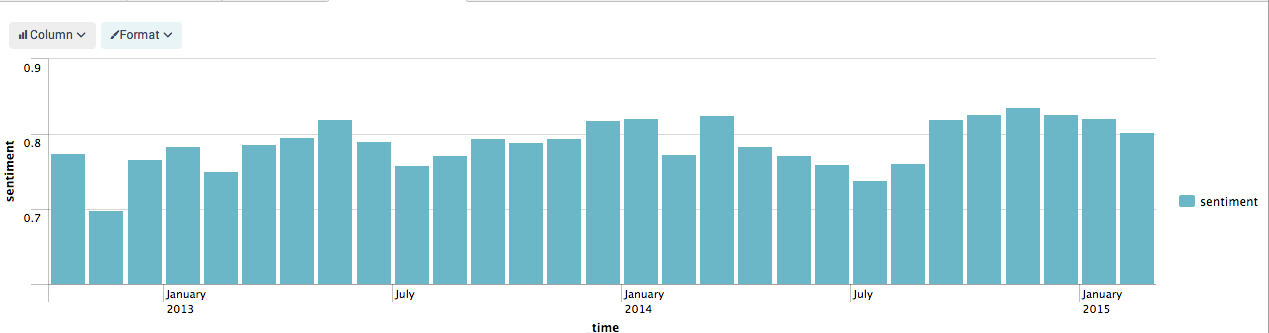
For example, I can chart average sentiment over time. To do this, you chain together multiple splunk search commands until the desired output is reached:
index=text_messages is_from_me=1 | sentiment twitter message | timechart avg(sentiment) as sentiment span=1mon
In english, it says:
- In index
text_messages, search for events which haveis_from_meequal to 1. - After that, run a sentiment analysis on the results'
messagefield. - Then use the results to chart the average of the
sentimentfield over time spans of one month."
The resulting graph looks like this:
By chaining together more complex series of commands, you can get some pretty cool results!
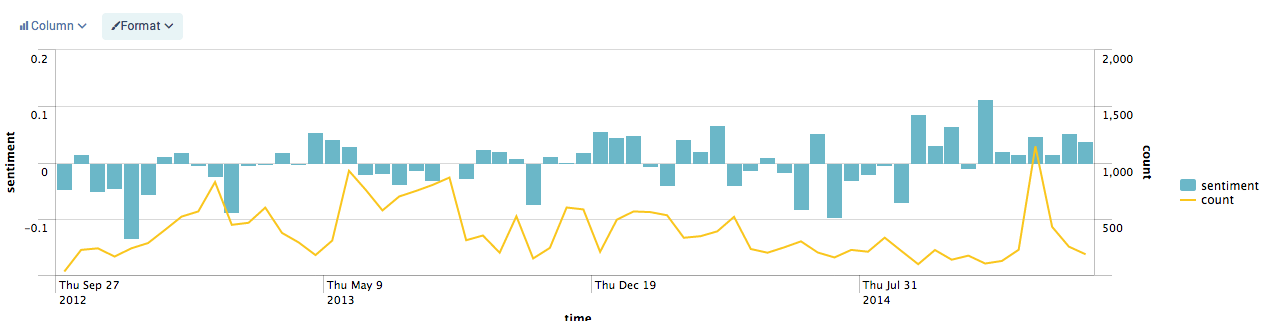
The next graph is created by finding the average sentiment and forming a baseline sentiment value, allowing good and bad sentiment to cancel each other out, leaving only a remainder.
Looking at the blue sentiment portion of the graph, zero is this baseline. Any column that falls below this has a "below average" sentiment while columns that are greater than zero posess an "above average" sentiment as compared with the rest of the events.
The second yellow line simply charts the number of events in each period.
index=text_messages is_from_me=1 | sentiment twitter message |eval diff=sentiment-0.788400| eval count=count| timechart avg(diff) as sentiment, count span=14d
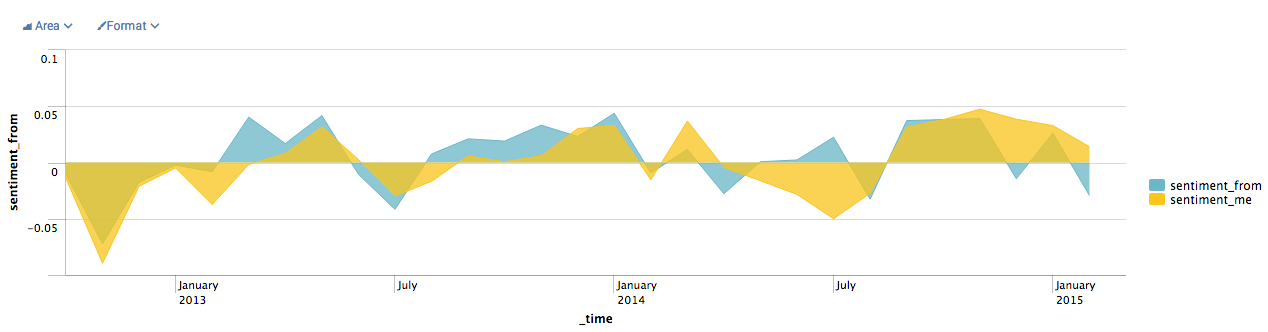
This last one is my favorite. It overlays the sentiment of incoming messages over the sentiment of outgoing messages. This was to test the hypothesis that the sentiment of incoming texts could affect the sentiment of outgouing texts. While correlation doesn't imply causation, I still think it's interesting that the graphs follow each other in so many places!
index=text_messages is_from_me=0 | sentiment twitter message | eval diff=sentiment-0.788400 | timechart avg(diff) as sentiment_from span=1mon | appendcols [search index=text_messages is_from_me=1 | sentiment twitter message | eval diff2=sentiment-0.788400 | timechart avg(diff2) as sentiment_me span=1mon]
It's truly fascinating how each of these events are pretty useless by themselves, however when you take them all into account some interesting information can be gleaned. I plan to continue on with this little Personal Analytics project by incorporating more data sources like sleep analysis, stay tuned!
If you're interested in this sort of thing, shoot me a tweet @YourBuddyConner, I'd love to hear what you think!